Timeline
Overview
Timeline is generally a part (usually the right one) of a Gantt diagram of both types. It shows processes durations (time periods), events with no duration (milestones) and connector between them, of which a whole task consists. Also there are a couple of elements that help you to navigate through the timeline. Timeline of a Project Chart is rather different from a timeline of a Resoure Gantt due to their different purpose. Later in this article we will look at both of them and consider that difference.
Resource Gantt Chart
This illustration highlights almost all major resource timeline elements, and this tutorial will describe how each element is configured:
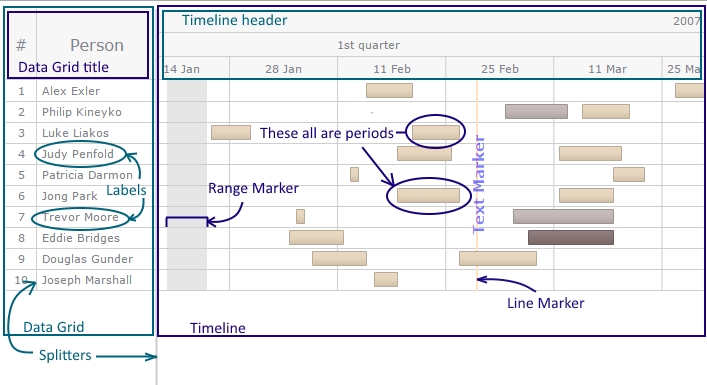
You can look up the Resource Chart article to know more about managing Gantt Charts of this type.
Project Gantt Chart
This illustration highlights almost all major project timeline elements, and this tutorial will describe how each element is configured:
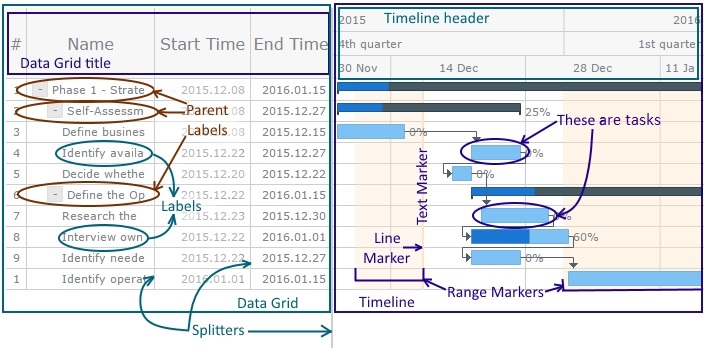
You can look up the Project Chart article to know more about managing Gantt Charts of this type.
Look at the samples or pictures of both Gantt diagram types. You can notice vertical borders on both types. These borders in the Data Grid part and the one that separates Data Grid and Timeline parts are splitters. They can be dragged: when you hover those splitters, you will how a mouse cursor will become of a typical kind for dragging.
Markers
There are three marker types we've got in Gantt Charts:
- lineMarker - puts a vertical line at the defined date and marks this point
- textMarker - to mark a point on a Gantt diagram with a text label
- rangeMarker - to highlight some parts of a Gantt Chart
Let's make a couple of samples with these markers.
First of all, let's create 2 line markers: one showing the current date and second one - the date when the ongoing process should become finished.
// create linemarkers
var tl = chart.getTimeline();
tl.lineMarker(0).value(anychart.enums.GanttDateTimeMarkers.CURRENT);
tl.lineMarker(1).value(now + 5*day);
As you see, we can define some parameters of each linemarker such as color, dashes or thickness using .stroke() method. It is used absolutely the same way as any other line settings with the .stroke() method.
Now, look at the sample with a textMarker showing the planned finish date and a rangeMarker showing the remaining time.
// creating a text marker
tl.textMarker(0).value(anychart.enums.GanttDateTimeMarkers.CURRENT);
// creating range markers
tl.rangeMarker(0).from(Date.UTC(2016, 0, 1)).to(anychart.enums.GanttDateTimeMarkers.END);
tl.rangeMarker(1).from(now - 7*day).to(anychart.enums.GanttDateTimeMarkers.CURRENT);
You might have noticed, that we used values of enumerated type in those samples above as a point in time. There is a list of enums that we can use to place the markers. Let's look at them.
Enums
The following Enums can be used to make timeling configuration easier:
| Enum | String value | Value returned |
|---|---|---|
| anychart.enums.GanttDateTimeMarkers.START | "start" | The first time point in the Gantt diagram timeline. |
| anychart.enums.GanttDateTimeMarkers.CURRENT | "current" | The current time point in the Gantt diagram timeline. |
| anychart.enums.GanttDateTimeMarkers.END | "end" | The last time point in the Gantt diagram timeline. |
Special Features
Due to unique organization of a Gantt diagram, there are some special features that should be mentioned.
- Any type of Gantt diagram will return "false" for .isHorizontal() method, because markers in Gantts can be only vertical.
- The scale and layout methods will not work here, only "dateTime" scale and "vertical" layout are available in Gantt Chart.
- There are three special values for setting to the text markers' .value() method: "start" and "end" to the range markers' from() and to(). The "value" returns the current date, "start" - the start date of the gantt chart timeline and "end" returns the end date of the whole Gantt diagram.
Visualisation
Despite being quite different in usage and purposes, markers behave identically when it comes to coloring, positioning and shaping them.
// creating and coloring a line marker
tl.lineMarker(0).value(Date.UTC(2007, 1, 29));
tl.lineMarker(0).stroke('2 #FFE4C4');
// creating and adjusting a text marker
tl.textMarker(0).value(Date.UTC(2007, 1, 29));
// changing the text setting
tl.textMarker(0).text('Text Marker').fontSize(15).fontColor('blue').fontWeight('bold').fontOpacity(0.5);
// creating and coloring a range marker
tl.rangeMarker(0).from(Date.UTC(2007, 0, 20)).to(Date.UTC(2007, 0, 25));
tl.rangeMarker(0).fill('#FFE4C4 0.5');
There are some methods inherent to the timeline only. You can see a table below with all timeline methods which can be used to change the color scheme of your Gantt diagram.
| # | Part of the timeline | Method | What for |
|---|---|---|---|
| 1 | Whole timeline | .rowEvenFill() | Colors even rows in the timeline |
| .rowOddFill() | Colors odd rows in the timeline | ||
| .rowHoverFill() | Colors hovered rows in the timeline | ||
| .rowSelectedFill() | Colors selected rows in the timeline | ||
| .columnStroke() | Colors ticks of the timeline | ||
| 2 | Timeline baseline | .baselineAbove() | Colors the baseline |
| .baselineFill() | Fills timeline baselines with a defined color | ||
| .baselineStroke() | Strokes timeline baselines with a defined color | ||
| 3 | Base coloring | .baseStroke() | Colors the stroke of the base elements |
| .baseFill() | Fills base elements with a defined color | ||
| 4 | Milestones | .milestoneFill() | Sets the filling color of a milestone |
| .milestoneStroke() | Sets the color for the milestone stroke | ||
| 5 | Parent Elements | .parentFill() | Defines the filling for parent elements in the timeline |
| .parentStroke() | Defines the stroke for parent elements in the timeline | ||
| 6 | Progress Bar | .progressFill() | Sets the progress bar filling |
| .progressStroke() | Sets the stroke for the progress bar | ||
| 7 | Connectors | .connectorFill() | Sets the connectors fillings |
| .connectorStroke() | Sets the stroke for the connectors | ||
| 8 | Periods | .selectedElementFill() | Sets the filling of the selected elements |
| .selectedElementStroke() | Sets the stroke of the selected elements |
There are two ways of defining colors and other visualization params: through those methods as usual or through the data while setting it. Using dataset to define some visualization settings gives you more flexibility as you can affect each data point separately, while methods act on all elements of each type together; also, we can affect only data points when we use the dataset. Let's try to create a couple of samples using both these ways.
Below you can find a sample of a Resource Gantt Chart where we set the rows' colors using .rowEvenFill(), .rowOddFill(), .rowHoverFill(), .rowSelectedFill() methods, the selected elements' colors using .selectedElementFill() and .selectedElementStroke() and change some data points' colors through the dataset.
// set colors to the rows in the timeline section
tl.rowEvenFill("#FFF3E0 0.5");
tl.rowOddFill("#E0F7FA 0.5");
tl.rowHoverFill("#eee");
tl.rowSelectedFill("#FFAB91");

// set colors for selected elements
tl.selectedElementFill("#FFAB00");
tl.selectedElementStroke("#B8AA96");

function getData() {
    return [
    {
    "id": "1",
    "name": "Alex Exler",
    "periods": [
    {"id": "1_1", "start": now - 10*day, "end": now + 4*day, "stroke": "#B8AA96", "fill": {"angle": 90, "keys": [{"color": "#CFC0A9", "position": 0}, {"color": "#E6D5BC", "position": 0.38}, {"color": "#E8D9C3", "position": 1}]}},
    {"id": "1_2", "start": now + 20*day, "end": now + 28*day, "stroke": "#B8AA96", "fill": {"angle": 90, "keys": [{"color": "#CFC0A9", "position": 0}, {"color": #E6D5BC", "position": 0.38}, {"color": "#E8D9C3", "position": 1}]}}]
}
Now, let's look at the Project Gantt Chart with parameters adjusted the same way. Here we made the milestones using .milestoneFill(), .milestoneStroke() and connnectors (with .connectorFill() and .connectorStroke() methods) of the custom colors, as well as some of the data points, using the dataset.
// set colors for milestones
tl.milestoneFill("#4A148C");
tl.milestoneStroke("#1A237E");

// set colors for the connectors
tl.connectorFill("#0D47A1");
tl.connectorStroke("#90CAF9");

function getData() {
    var now = (new Date()).getTime();
    var sec = 1000;
    var min = 60 * sec;
    var hour = 60 * min;
    var day = 24 * hour;
    return [
    {
        "id": "8",
        "name": "Interview owners of similar businesses",
        parent: "6",
        "progressValue": "60%",
        "actualStart": (now + 5 * day),
        "actualEnd": (now + 15 * day),
        "connectTo": "9",
        "actual": {
            "fill": "red"
        },
        "progress": {
            "fill": {
                "color": "black",
                "opacity": 0.3
            }
        },
        "connectorType": "FinishStart"
    }}