Loading Google Spreadsheet
Overview
Ability to load data from Google Spreadsheet is one of the features Data Adapter provides.
To work with the features Data Adapter provides you need to plug it in along with AnyChart Library:
<!-- Include the data adapter -->
<script src="https://cdn.anychart.com/js/latest/data-adapter.min.js"></script>
When the Data Adapter is plugged in, you can use the loadGoogleSpreadsheet() method.
Spreadsheet format and Access
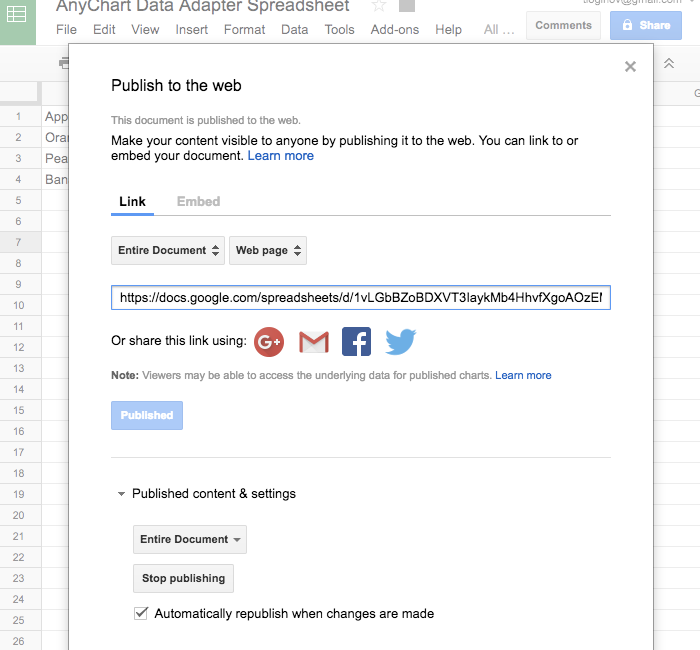
AnyChart Data Adapter can be used to load only Google Spreadsheets that are:
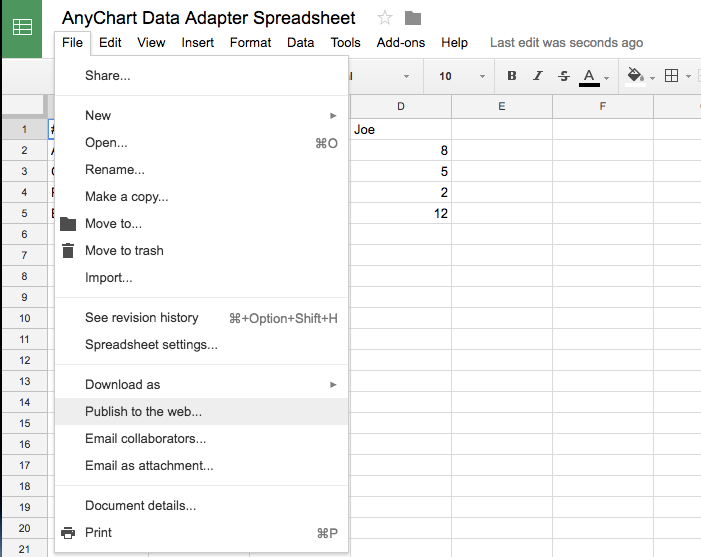
- Published to the Web: File > Publish to the web
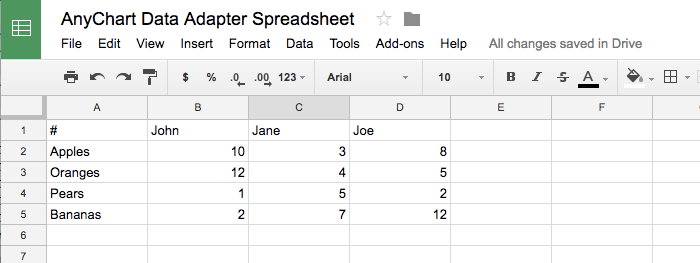
- Follow the certain format, where the first row must contain series names and first column - arguments:
Loading Spreadsheet
Use loadGoogleSpreadsheet() to load a spreadsheet:
anychart.data.loadGoogleSpreadsheet('1vLGbBZoBDXVT3IaykMb4HhvfXgoAOzEM3Rrk1xLN5aU', function(data) {
	// the data default sheet is loaded into the "data" variable
});
Key
A spreadsheet is identified and load by key, which is a part of sharing URL, for example, for this sharing URL:
https://docs.google.com/spreadsheets/d/1vLGbBZoBDXVT3IaykMb4HhvfXgoAOzEM3Rrk1xLN5aU/pubhtml
The key is 1vLGbBZoBDXVT3IaykMb4HhvfXgoAOzEM3Rrk1xLN5aU, it should be passed as the first parameter to loadGoogleSpreadsheet() method.
Sheet
By default the loadGoogleSpreadsheet() method loads the default sheet, to load any other sheet you need to pass either the index of the sheet:
anychart.data.loadGoogleSpreadsheet({key: 1vLGbBZoBDXVT3IaykMb4HhvfXgoAOzEM3Rrk1xLN5aU', sheet: '2'}, function(data) {
	// the data from the sheet #2 is loaded into the "data" variable
});
Or you need to specify the unique identifier of the sheet, the only way to figure out the identifier is to proceed to spreadsheet XML that follows http://schemas.google.com/spreadsheets/2006 schema and locate <id> tag in <entry> tag. For example, for our sample sheet, https://spreadsheets.google.com/feeds/worksheets/1vLGbBZoBDXVT3IaykMb4HhvfXgoAOzEM3Rrk1xLN5aU/public/basic, the <entry> for the second sheet looks like this:
<entry>
<id>
https://spreadsheets.google.com/feeds/worksheets/1vLGbBZoBDXVT3IaykMb4HhvfXgoAOzEM3Rrk1xLN5aU/public/basic/obqmz8q
</id>
<updated>2017-05-28T13:09:46.163Z</updated>
<category scheme="http://schemas.google.com/spreadsheets/2006" term="http://schemas.google.com/spreadsheets/2006#worksheet"/>
<title type="text">Sales: Vegetables</title>
<content type="text">Sales: Vegetables</content>
<link rel="http://schemas.google.com/spreadsheets/2006#listfeed" type="application/atom+xml" href="https://spreadsheets.google.com/feeds/list/1vLGbBZoBDXVT3IaykMb4HhvfXgoAOzEM3Rrk1xLN5aU/obqmz8q/public/basic"/>
<link rel="http://schemas.google.com/spreadsheets/2006#cellsfeed" type="application/atom+xml" href="https://spreadsheets.google.com/feeds/cells/1vLGbBZoBDXVT3IaykMb4HhvfXgoAOzEM3Rrk1xLN5aU/obqmz8q/public/basic"/>
<link rel="http://schemas.google.com/visualization/2008#visualizationApi" type="application/atom+xml" href="https://docs.google.com/spreadsheets/d/1vLGbBZoBDXVT3IaykMb4HhvfXgoAOzEM3Rrk1xLN5aU/gviz/tq?gid=709869616&pub=1"/>
<link rel="http://schemas.google.com/spreadsheets/2006#exportcsv" type="text/csv" href="https://docs.google.com/spreadsheets/d/1vLGbBZoBDXVT3IaykMb4HhvfXgoAOzEM3Rrk1xLN5aU/export?gid=709869616&format=csv"/>
<link rel="self" type="application/atom+xml" href="https://spreadsheets.google.com/feeds/worksheets/1vLGbBZoBDXVT3IaykMb4HhvfXgoAOzEM3Rrk1xLN5aU/public/basic/obqmz8q"/>
<gs:colCount>26</gs:colCount>
<gs:rowCount>1000</gs:rowCount>
</entry>
Which means that sheet unique identifier is obqmz8q and it can be loaded like that:
anychart.data.loadGoogleSpreadsheet({key: 1vLGbBZoBDXVT3IaykMb4HhvfXgoAOzEM3Rrk1xLN5aU', sheet: 'obqmz8q'}, function(data) {
	// the data from the sheet with 'obqmz8q' id is loaded into the "data" variable
});
Setting Data
The loadGoogleSpreadsheet() method just loads the data into a variable, the data is stored in anychart.data.DataSettings format, which is also used when data is loaded from HTML Tables.
You have to create a chart yourself and then pass data to a chart. Please see a set of samples below.
From the default sheet
Create a multi-series Column chart from a default sheet:
anychart.data.loadGoogleSpreadsheet('1vLGbBZoBDXVT3IaykMb4HhvfXgoAOzEM3Rrk1xLN5aU', function(data) {
	// the data default sheet is loaded into the "data" variable
	// create a chart
	chart = anychart.column();
	// set data
	chart.data(data);
	// display a chart
	chart.container('container');
	chart.draw();
});
Here is a live sample:
From a sheet by index
Create a multi-series Line chart from the second sheet:
anychart.data.loadGoogleSpreadsheet({key: '1vLGbBZoBDXVT3IaykMb4HhvfXgoAOzEM3Rrk1xLN5aU', sheet: '2'}, function(data) {
	// the data from the sheet #2 is loaded into the "data" variable
	// create a chart
	chart = anychart.line();
	// set data
	chart.data(data);
	// display a chart
	chart.container('container');
	chart.draw();
});
Here is a live sample:
From a sheet by id
Create a single-series Pie chart from the second sheet by id:
anychart.data.loadGoogleSpreadsheet({key: '1vLGbBZoBDXVT3IaykMb4HhvfXgoAOzEM3Rrk1xLN5aU', sheet: 'obqmz8q'}, function(data) {
	// the data from the sheet with 'obqmz8q' id is loaded into the "data" variable
	// create a chart
	chart = anychart.pie();
	// set data
	chart.data(data);
	// display a chart
	chart.container('container');
	chart.draw();
});
Here is a live sample: