Technical Indicators Mathematical Description
- Overview
- Accumulation Distribution Line
- Adaptive Moving Average
- Aroon
- Average True Range
- Bollinger Bands
- Bollinger Bands %B
- Bollinger Bands Width
- Commodity Channel Index
- Chaikin Money Flow
- Chaikin Oscillator
- Chaikin Volatility
- Directional Movement Indicator
- Exponential Moving Average
- KDJ
- Keltner Channels
- Modified Moving Average
- Money Flow Index
- Momentum
- Moving Average Convergence Divergence
- Moving Average Envelopes
- On Balance Volume
- Parabolic SAR
- Price Channels
- Rate of Change
- Relative Strength Index
- Simple Moving Average
- Stochastic Oscillator
- TRIX
- Volume + MA
- Williams %R
Overview
This document contains mathematical description of all technical indicators available in AnyChart Stock Component.
For all formulas and indicators below:
- n is a period for which calculations are done, it is usually set by the period parameter of the method that creates an indicator.
- Xi is the value passed by the data source.
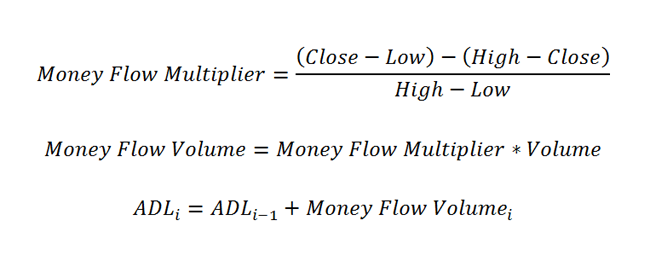
Accumulation Distribution Line
Accumulation Distribution Line is calculated according to these formulas:
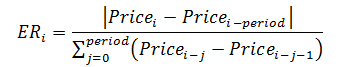
Adaptive Moving Average
Each point of the Adaptive Moving Average indicator is calculated by the following steps:
- Calculate the ER:
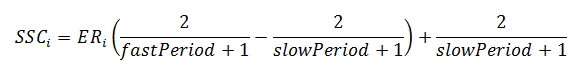
- Then, use the following formula to calculate the SSC value:
- Now, use the results from the actions made before and calculate the indicator:

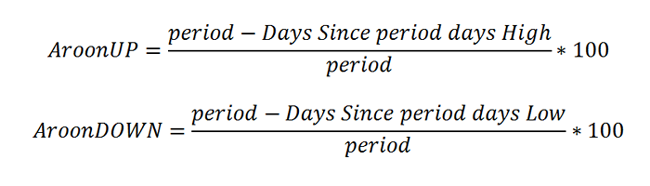
Aroon
Aroon indicator is calculated according to the following formula:
Average True Range
Average True Range in each point is calculated according to the following formula:
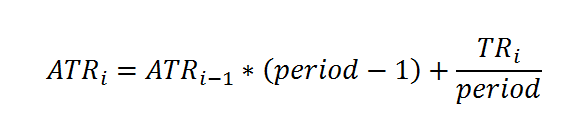
This formula is based on the True Range definition. ATR is defined as the greatest of the following:
- current High less than current Low
- current High less than previous Close (absolute value)
- current Low less than previous Close (absolute value)
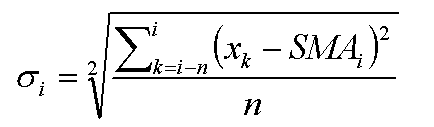
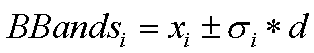
Bollinger Bands
Bollinger Bands indicator is calculated in three steps:
- Calculate the SMA according to the SMA formula.
- Use the next formula to calculate the standard deviation:
- Bollinger Bands values are calculated according to this formula, where "d" is a deviation:
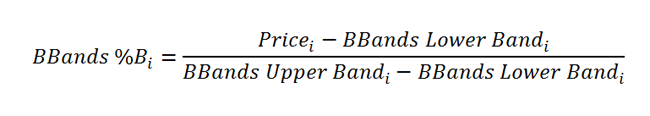
Bollinger Bands %B
The Bollinger Bands %B indicator is calculated according to the following formula:
Bollinger Bands Width
The Bollinger Bands Width article indicator is calculated according to the following formula:
bandwidth = (upperBB − lowerBB) / middleBB
Commodity Channel Index
Commodity Channel Index is calculated according to this formula:
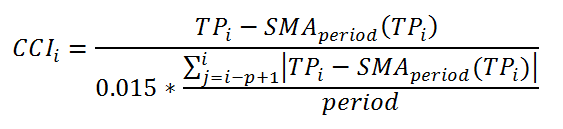
Where TP is a Typical Price calculated as:
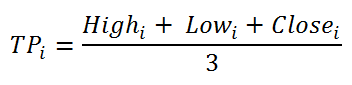
And SMA is calculated as stated in SMA part of this article.
Chaikin Money Flow
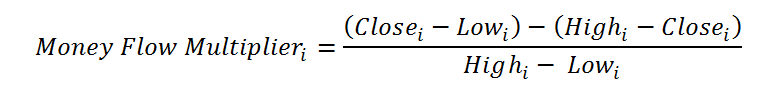
Chaikin Money Flow is calculated in three steps.
- First a MFM(i) is calculated for all points according to this formula:
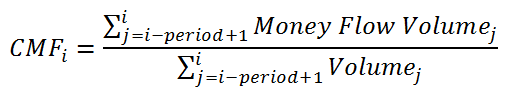
- Next an MFV(i) value is calculated for all points like this:
- And finally the CMF(i) value is calculated according to this formula:

Chaikin Oscillator
Chaikin Oscillator is calculated according to this formula:

You can see how the ADL indicator is calculated in the ADL part of this article.
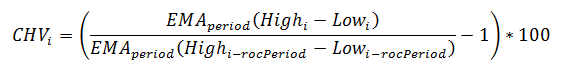
Chaikin Volatility
Coming soon.
Chaikin Volatility indicator in each point is calculated according to the following formula:
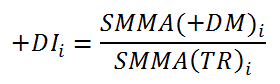
Directional Movement Indicator
Directional Movement Indicator is calculated in three steps:
- First the True Range (TR), Plus Directional Movement (+DM) and Minus Directional Movement (-DM) are calculated for each period:
- Next they are smoothed using EMA or Wilder's method, calculated as:
- And finally the +DI and -DI values are calculated according to these formulas:

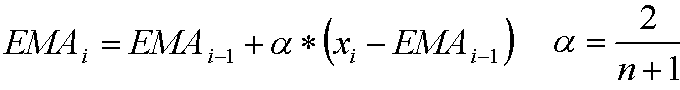
Exponential Moving Average
Exponential Moving Average in each point is calculated according to the following formula:
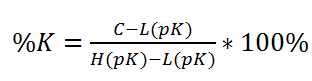
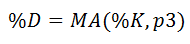
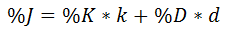
KDJ
KDJ is calculated quite alike Stochastic indicator, but the difference is in having a J line, which Stochastic does not have.
- The %K line is calculated the following way:
- To create the %D line, use the next formula:
- This is how the %J line is calculated:
Keltner Channels
Coming soon.
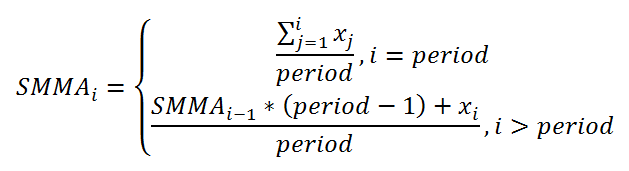
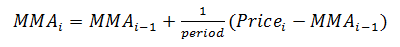
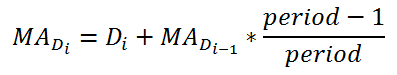
Modified Moving Average
Modified Moving Average indicator points are calculated by the following formula:
Money Flow Index
Coming soon.
Momentum
Coming soon.
Moving Average Convergence Divergence
Moving Average Convergence Divergence indicator is calculated as follows:
- EMA[slow period]i and EMA[fast period]i is calculated by EMA formula. Slow period and fast period are set by slowPeriod (default 26) and fastPeriod (default 12) parameters of macd() method.
- MACD series value is calculated:

- EMA[signal period]i of MACD series values is calculated by EMA formula, where signal period is set by signalPeriod parameter.
- Signal series value is calculated:

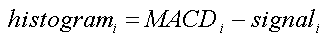
- Histogram series is calculated:
Moving Average Envelopes
Coming soon.
On Balance Volume
Coming soon.
Parabolic SAR
Coming soon.
Price Channels
Coming soon.
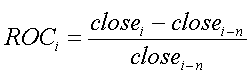
Rate of Change
Rate of Change is calculated according to this formula:
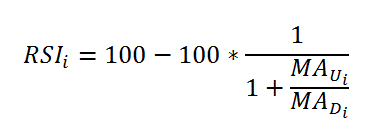
Relative Strength Index
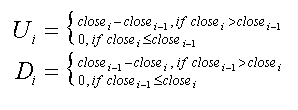
Relative Strength Index is calculated as follows:
- Upward change (U) or downward change (D) sequences are calculated:
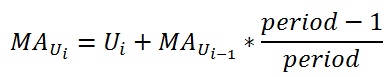
- Then two averages are calculated:
- And final RSI formula is :
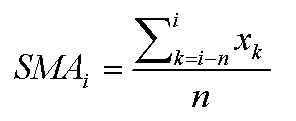
Simple Moving Average
Simple Moving Average in each point is calculated according to the following formula:
Stochastic Oscillator
Stochastic Oscillator indicator has two series, both being calculated with the help of other indicators (EMA or SMA). Also it has 3 types: Fast Stochastic Oscillator, Slow Stochastic Oscillator and Full Stochastic Oscillator.
The defaults create a Fast Stochastic Oscillator indicator.
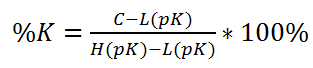
where pK is the first period that is set through the stochastic() method, which is a period for the %K value.
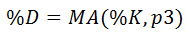
where p3 is the third period that is set through the stochastic() method, which is a period for the %D value.
While Fast Stochastic Oscillator is used for signals, the Slow Stochastic Oscillator is supposed to reflect this emphasis.
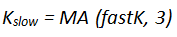
where 3 is a default period for getting slow K.
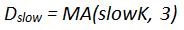
where 3 is a default period for getting slow D.
The Full Stochastic Oscillator is a fully customizable version of the Slow Stochastic Oscillator. Users can set the look-back period, the number of periods to slow %K and the number of periods for the %D moving average.
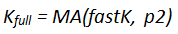
where p2 is the second period that is set through the stochastic() method, which is a period for the smoothed %K value.
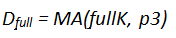
where p3 is the third period that is set through the stochastic() method, which is a period for the %D value.
TRIX
Coming soon.
Volume + MA
Coming soon.
Williams %R
Coming soon.