Technical Indicators Mathematical Description
- Overview
- Accumulation Distribution Line
- Adaptive Moving Average
- Aroon
- Average True Range
- Awesome Oscillator
- Bollinger Bands
- Bollinger Bands %B
- Bollinger Bands Width
- Commodity Channel Index
- Chaikin Money Flow
- Chaikin Oscillator
- Chaikin Volatility
- Directional Movement Indicator
- Envelope
- Exponential Moving Average
- Heikin-Ashi
- Ichimoku Cloud
- KDJ
- Keltner Channels
- Modified Moving Average
- Money Flow Index
- Momentum
- Moving Average Convergence Divergence
- Moving Average Envelopes
- On Balance Volume
- Parabolic SAR
- Price Channels
- Price Oscillator
- Psychological Line
- Rank Correlation Index
- Rate of Change
- Ratiocator
- Relative Strength Index
- Simple Moving Average
- Stochastic Oscillator
- Triple Exponential Moving Average
- Volume + Moving Average
- Williams %R
Overview
This document contains mathematical description of all technical indicators available in AnyChart Stock Component.
For all formulas and indicators below:
- n is a period for which calculations are done, it is usually set by the period parameter of the method that creates an indicator.
- Xi is the value passed by the data source.
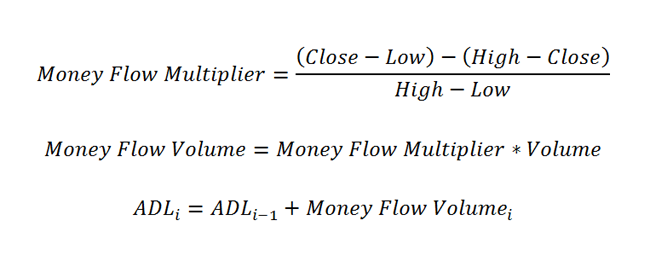
Accumulation Distribution Line
Accumulation Distribution Line is calculated according to these formulas:
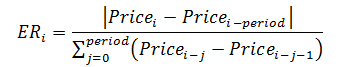
Adaptive Moving Average
Each point of the Adaptive Moving Average indicator is calculated by the following steps:
- Calculate the ER:
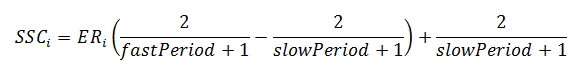
- Then, use the following formula to calculate the SSC value:
- Now, use the results from the actions made before and calculate the indicator:

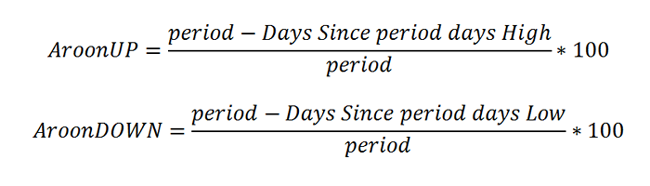
Aroon
Aroon indicator is calculated according to the following formulas:
Average True Range
Average True Range in each point is calculated according to the following formula:
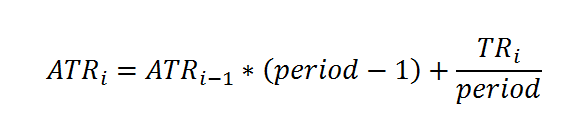
This formula is based on the True Range definition. ATR is defined as the greatest of the following:
- current High less than current Low
- current High less than previous Close (absolute value)
- current Low less than previous Close (absolute value)
Awesome Oscillator
Awesome Oscillator is calculated according to the following formula:
Median Price = (High + Low) / 2 AO = SMA (Median Price, 5) - SMA (Median Price, 34)
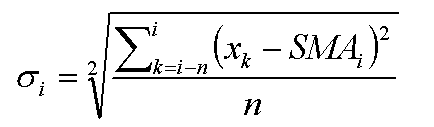
Bollinger Bands
Bollinger Bands indicator is calculated in three steps:
- Calculate the SMA according to the SMA formula.
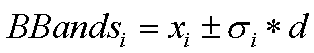
- Use the next formula to calculate the standard deviation:
- Bollinger Bands values are calculated according to this formula, where "d" is a deviation:
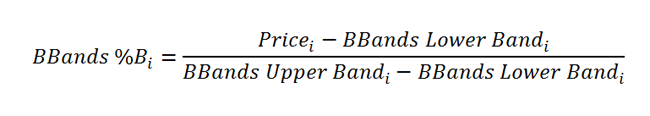
Bollinger Bands %B
The Bollinger Bands %B indicator is calculated according to the following formula:
Bollinger Bands Width
The Bollinger Bands Width article indicator is calculated according to the following formula:
bandwidth = (upperBB - lowerBB) / middleBB
Commodity Channel Index
Commodity Channel Index is calculated according to this formula:
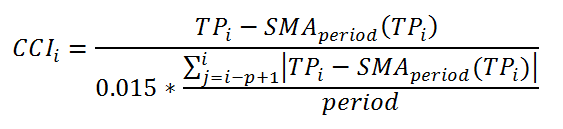
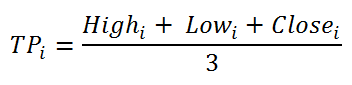
Where TP is a Typical Price calculated as:
And SMA is calculated as stated in SMA part of this article.
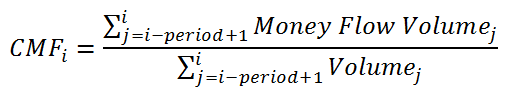
Chaikin Money Flow
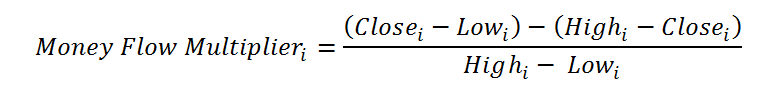
Chaikin Money Flow is calculated in three steps.
- First a MFM(i) is calculated for all points according to this formula:
- Next an MFV(i) value is calculated for all points like this:
- And finally the CMF(i) value is calculated according to this formula:

Chaikin Oscillator
Chaikin Oscillator is calculated according to this formula:

You can see how the ADL indicator is calculated in the ADL part of this article.
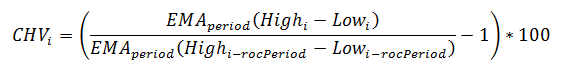
Chaikin Volatility
Chaikin Volatility indicator in each point is calculated according to the following formula:
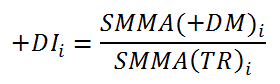
Directional Movement Indicator
Directional Movement Indicator is calculated in three steps:
- First the True Range (TR), Plus Directional Movement (+DM) and Minus Directional Movement (-DM) are calculated for each period:
- Next they are smoothed using EMA or Wilder's method, calculated as:
- And finally the +DI and -DI values are calculated according to these formulas:

Envelope
Envelope is calculated according to the following formulas:
- Upper Envelope: 20 Period SMA + (20 Period SMA * 0.1)
- Lower Envelope: 20 Period SMA - (20 Period SMA * 0.1)
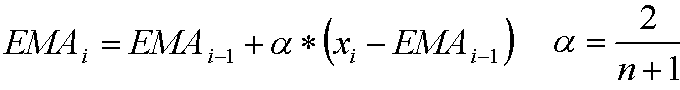
Exponential Moving Average
Exponential Moving Average in each point is calculated according to the following formula:
Heikin-Ashi
Heikin-Ashi indicator is based on price data from the current open-high-low-close, the current Heikin-Ashi values, and the prior Heikin-Ashi values.
In the formulas below, (0) refers to the current period, (-1) to the prior period, and HA to Heikin-Ashi:
- The Heikin-Ashi Close is simply an average of the open, high, low, and close for the current period: HA-Close = (Open(0) + High(0) + Low(0) + Close(0)) / 4
- The Heikin-Ashi Open is the average of the prior Heikin-Ashi candlestick open plus the close of the prior Heikin-Ashi candlestick: HA-Open = (HA-Open(-1) + HA-Close(-1)) / 2
- The Heikin-Ashi High is the maximum of three data points - the current period's high, the current Heikin-Ashi candlestick open, or the current Heikin-Ashi candlestick close: HA-High = Maximum of the High(0), HA-Open(0) or HA-Close(0)
- The Heikin-Ashi Low is the minimum of three data points - the current period's low, the current Heikin-Ashi candlestick open, or the current Heikin-Ashi candlestick close: HA-Low = Minimum of the Low(0), HA-Open(0) or HA-Close(0)
Ichimoku Cloud
Ichimoku Cloud (IKH) includes five plots. Four of them are based on the average of the high and low over a given period of time. Periods can be adjusted when an indicator is created.
This is how Ichimoku Cloud is calculated:
- Tenkan-sen (Conversion Line): (9-period high + 9-period low)/2))
- Kijun-sen (Base Line): (26-period high + 26-period low)/2))
- Senkou Span A (Leading Span A): (Conversion Line + Base Line)/2))
- Senkou Span B (Leading Span B): (52-period high + 52-period low)/2))
- Chikou Span (Lagging Span): Close plotted 26 days in the past
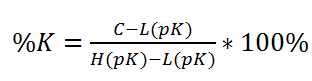
KDJ
KDJ is calculated quite alike Stochastic indicator, but the difference is in having a J line, which Stochastic does not have.
- The %K line is calculated the following way:
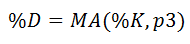
- To create the %D line, use the next formula:
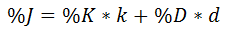
- This is how the %J line is calculated:
Keltner Channels
Keltner Channels bands in each point are calculated according to the following formulas:
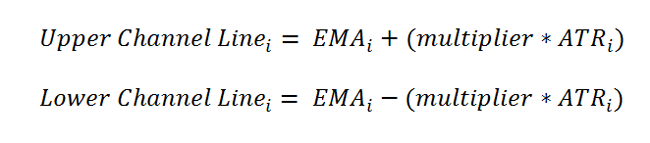
You can see how EMA (Exponential Moving Average) and ATR (Average True Range) indicators are calculated in corresponding sections of this article.
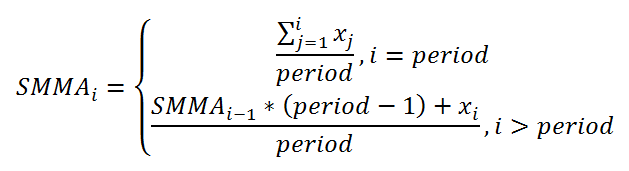
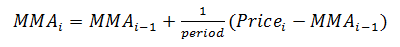
Modified Moving Average
Modified Moving Average indicator points are calculated by the following formula:
Money Flow Index
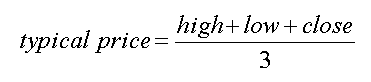
Money Flow Index is calculated as follows:
- The typical price for each day is the average of high, low and close:
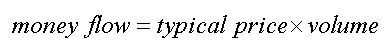
- Money flow is the product of typical price and the volume on that day:
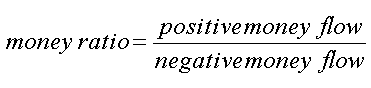
- Totals of the money flow amounts over the given N days are then formed. Positive money flow is the total for those days where the typical price is higher than the previous day's typical price, and negative money flow where below. If typical price is unchanged then that day is discarded.
- A money ratio is then formed:
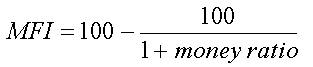
- From which a money flow index ranging from 0 to 100 is formed:
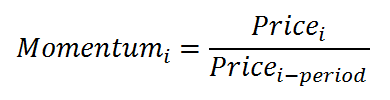
Momentum
Momentum indicator in each point is calculated according to the following formula:
Moving Average Convergence Divergence
Moving Average Convergence Divergence indicator is calculated as follows:
- EMA[slow period]i and EMA[fast period]i is calculated by EMA formula. Slow period and fast period are set by slowPeriod (default 26) and fastPeriod (default 12) parameters of macd() method.
- MACD series value is calculated according to this formula:

- EMA[signal period]i of MACD series values is calculated by EMA formula, where signal period is set by signalPeriod parameter.
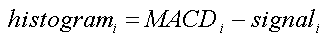
- Signal series value:

- Histogram serie:
Moving Average Envelopes
Coming soon.
On Balance Volume
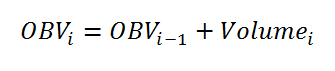
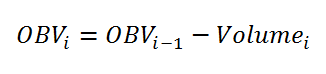
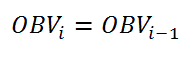
On Balance Volume indicator is calculated according to the following rules:
- If the closing price is above the prior close price, then:
- If the closing price is below the prior close price, then:
- If the closing prices equals yesterday's closing price, then:
Parabolic SAR
Parabolic SAR is created according to the algorithm described below.
At each step within a trend, the SAR is calculated ahead of time. That is, tomorrow's SAR value is built using data available today. The general formula used for this is:
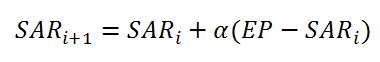
where SARi and SARi - 1 represent today's and tomorrow's SAR values, respectively.
The extreme point, EP, is a record kept during each trend that represents the highest value reached by the price during the current up trend - or lowest value during a downtrend. On each period, if a new maximum (or minimum) is observed, the EP is updated with that value.
The α value represents the acceleration factor. Usually, this is set to a value of 0.02 initially. This factor is increased by 0.02 each time a new EP is recorded.
To keep it from getting too large, a maximum value for the acceleration factor is normally set at 0.20, so that it never goes beyond that.
The SAR is recursively calculated in this manner for each new period. There are, however, two special cases that will modify the SAR value:
- If tomorrow's SAR value lies within (or beyond) today's or yesterday's price range, the SAR must be set to the closest price bound. For example, if in an up trend, the new SAR value is calculated and it results to be greater than today's or yesterday's lowest price, the SAR must be set equal to that lower boundary.
- If tomorrow's SAR value lies within (or beyond) tomorrow's price range, a new trend direction is then signaled, and the SAR must "switch sides." Upon a trend switch, several things happen. The first SAR value for this new trend is set to the last EP recorded on the previous trend. The EP is then reset accordingly to this period's maximum. The acceleration factor is reset to its initial value.
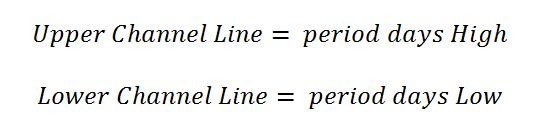
Price Channels
Price Channels bands are calculated according to the following formulas:
Price Oscillator
Price Oscillator (PPO) is calculated according to the following formulas:
- PPO Line: ((12-day EMA - 26-day EMA)/26-day EMA) x 100
- Signal Line: 9-day EMA of PPO
- PPO Histogram: PPO - Signal Line
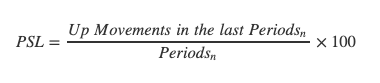
Psychological Line
Psychological Line (PSY) is calculated according to the following formula:
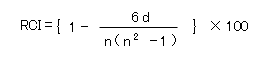
Rank Correlation Index
Rank Correlation Index (RCI) is calculated according to the following formula:
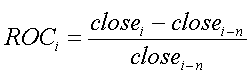
Rate of Change
Rate of Change is calculated according to this formula:
Ratiocator
Ratiocator (RAT) is calculated as follows:
- FirstRatiocator = PriceA / PriceB, where priceA and priceB are prices of two stocks on a given BaseDate
- Ratiocator = (PriceA / PriceB) / FirstRatiocator * 100
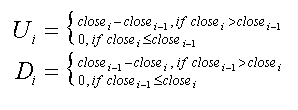
Relative Strength Index
Relative Strength Index is calculated as follows:
- Upward change (U) or downward change (D) sequences are calculated:
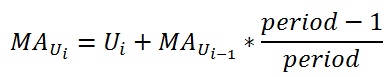
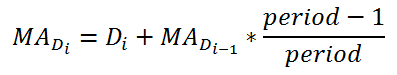
- Then two averages are calculated:
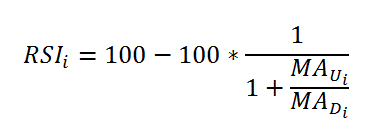
- And final RSI formula is :
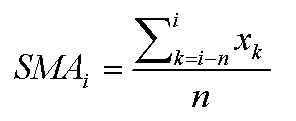
Simple Moving Average
Simple Moving Average in each point is calculated according to the following formula:
Stochastic Oscillator
Stochastic Oscillator indicator has two series, both being calculated with the help of other indicators (EMA or SMA). Also it has 3 types: Fast Stochastic Oscillator, Slow Stochastic Oscillator, and Full Stochastic Oscillator.
1. By default, a Fast Stochastic Oscillator indicator is created, which is calculated according to the following formula:
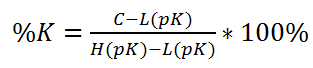
where pK is the first period that is set through the stochastic() method, which is a period for the %K value:
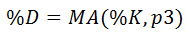
where p3 is the third period that is set through the stochastic() method, which is a period for the %D value.
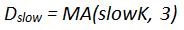
2. While Fast Stochastic Oscillator is used for signals, the Slow Stochastic Oscillator is supposed to reflect this emphasis:
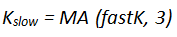
where 3 is a default period for getting slow K:
where 3 is a default period for getting slow D.
3. The Full Stochastic Oscillator is a fully customizable version of the Slow Stochastic Oscillator. Users can set the look-back period, the number of periods to slow %K, and the number of periods for the %D moving average:
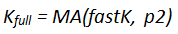
where p2 is the second period that is set through the stochastic() method, which is a period for the smoothed %K value:
where p3 is the third period that is set through the stochastic() method, which is a period for the %D value.
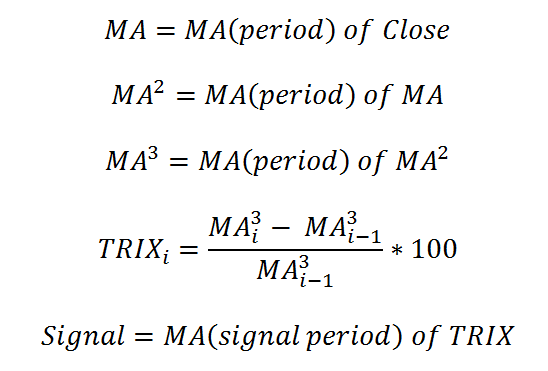
Triple Exponential Moving Average
Triple Exponential Moving Average (TRIX) and its signal line are calculated according to the following formulas:
Volume + Moving Average
Volume + Moving Average does no calculations with Volume and adds moving average of either SMA or EMA type calculated from the Volume series.
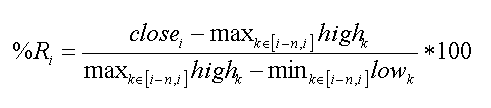
Williams %R
Williams %R is calculated according to this formula: