Resource Gantt Chart
Overview
The Resource Gantt chart, defined as an instance of anychart.charts.Gantt class, is used to schedule resources (e.g., equipment or employees).
Each resource is shown over periods of time, which are visualized as horizontal bars - the width of bars represents the duration. It is also possible to show hierarchical relationships between resources.
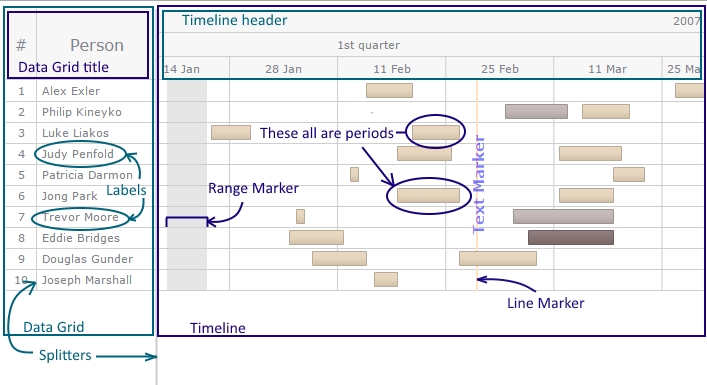
This is how the Resource chart is structured:
This article explains how to organize data for the Resource chart and what timeline elements it displays.
Quick Start
To create a Resource Gantt chart, use the anychart.ganttResource chart constructor, like in the sample below. To learn more, see the Quick Start (Resource) article.
// create data
var data = [
  {
    id: "1",
    name: "Server 1",
    periods: [
      {id:"1_1", start: "2018-01-05", end: "2018-01-25"},
      {id:"1_2", start: "2018-01-28", end: "2018-02-22"},
      {id:"1_3", start: "2018-03-03", end: "2018-03-25"}
  ]},
  {
    id: "2",
    name: "Server 2",
    periods: [
      {id: "2_1", start: "2018-01-07", end: "2018-02-15"},
      {id: "2_2", start: "2018-02-26", end: "2018-03-20"}
  ]},
  {
    id: "3",
    name: "Server 3",
    periods: [
      {id: "3_1", start: "2018-01-04", end: "2018-03-25"}
  ]}
];

// create a data tree
var treeData = anychart.data.tree(data, "as-table");

// create a chart
var chart = anychart.ganttResource();

// set the data
chart.data(treeData);

// set the container id
chart.container("container");

// initiate drawing the chart
chart.draw();

// fit elements to the width of the timeline
chart.fitAll();
Data
Data Fields
The Resource chart requires setting resources by using the following data fields:
idto set unique identifiersnameto set names
A resource can include a period or periods. Use these fields:
periodsto add an array of periodsidto set unique identifiersstartto set start datesendto set end dates
In addition, you can use optional fields:
children/parentto set the hierarchyrowHeightto set the row heightconnectToandconnectorTypeto add connectorsmarkersto add markerscollapsedto expand or collapse a parent resource
Note 1: To learn how to rename the default data fields, see Data: Mapping.
Note 2: You can also add custom fields to your data and use them to configure text - like, for example, in all the samples from Timeline: Tooltips.
Setting Data
To create a Resource chart, you should use the tree data model and organize your data either as a tree or as a table.
1. Creating Data Tree. The first step is creating a data tree by passing your data to the anychart.data.tree() method with "as-tree" or "as-table" as the second parameter:
var treeData = anychart.data.tree(data, "as-tree");
var treeData = anychart.data.tree(data, "as-table");
If the hierarchy between data items is not specified, there is no difference between the tree and table structures, and both parameters can be used.
For example, in the Quick Start section, there is a sample where the "as-table" parameter is used, but it can be replaced with "as-tree" without changing the data structure since all data items occupy the same place in the hierarchy.
2. Creating Chart. Then create a Resource chart by using the anychart.ganttResource() chart constructor:
var chart = anychart.ganttResource();
3. Setting Data. Finally, pass the data tree to the data() method of the chart:
chart.data(treeData);
You can as well skip the first step and pass your data directly to the data() method, also with the "as-tree" or "as-table" parameter. In this case the data tree is created implicitly.
Hierarchy
You can specify hierarchical relationships between data items of a Resource Gantt chart. There are two ways to set them, depending on how you organize the data: as a tree or as a table.
Please note that Resource charts can have multiple roots. Also, you can create data without specifying the hierarchy, like in the Quick Start section. In this case, technically, all items are roots.
As Tree
If you organize data as a tree, each parent item should have a children data field where an array of child items is specified.
The following sample shows how to set data with two roots as a tree:
// create data
var data = [
  {
    id: "A",
    name: "Location A",
    children: [
      {
        id: "1",
        name: "Server 1",
        periods: [
          {id: "1_1", start: "2018-01-05", end: "2018-01-25"},
          {id: "1_2", start: "2018-01-28", end: "2018-02-22"},
          {id: "1_3", start: "2018-03-03", end: "2018-03-25"}
      ]},
      {
        id: "2",
        name: "Server 2",
        periods: [
          {id: "2_1", start: "2018-01-07", end: "2018-02-15"},
          {id: "2_2", start: "2018-02-26", end: "2018-03-20"}
      ]}
  ]},
  {
    id: "B",
    name: "Location B",
    children: [
      {
        id: "3",
        name: "Server 3",
        periods: [
          {id: "3_1", start: "2018-01-04", end: "2018-03-25"}
      ]}
  ]}
];

// create a data tree
var treeData = anychart.data.tree(data, "as-tree");

// create a chart
var chart = anychart.ganttResource();

// set the data
chart.data(treeData);
As Table
If you organize data as a table, in the parent field of each item, you should specify the id value of its parent. The parent of a root item should be set to null or just not specified.
This sample shows how to set data with two roots as a table:
// create data
var data = [
  {
    id: "A",
    name: "Location A",
    parent: null
  },
  {
    id: "1",
    name: "Server 1",
    parent: "A",
    periods: [
      {id: "1_1", start: "2018-01-05", end: "2018-01-25"},
      {id: "1_2", start: "2018-01-28", end: "2018-02-22"},
      {id: "1_3", start: "2018-03-03", end: "2018-03-25"}
  ]},
  {
    id: "2",
    name: "Server 2",
    parent: "A",
    periods: [
      {id: "2_1", start: "2018-01-07", end: "2018-02-15"},
      {id: "2_2", start: "2018-02-26", end: "2018-03-20"}
  ]},
  {
    id: "B",
    name: "Location B",
    parent: null
  },
  {
    id: "3",
    name: "Server 3",
    parent: "B",
    periods: [
      {id: "3_1", start: "2018-01-04", end: "2018-03-25"}
  ]}
];

// create a data tree
var treeData = anychart.data.tree(data, "as-table");

// create a chart
var chart = anychart.ganttResource();

// set the data
chart.data(treeData);
Elements
This section lists the available types of elements that are shown on the timeline of the Resource chart and explains how to use data fields to set them. To learn how to configure elements, see the Elements section.
The main timeline element of the Resource chart is the period, but logically, periods are grouped into resources - see Periods and Resources. Also, you can add connectors and set markers by adding special data fields to periods and resources.
Periods and Resources
Resources are logical elements that do not have a direct representation on the timeline, but their names are shown in data grid labels.
If there are hierarchical relationships between data items, parent resources are visualized as empty rows on the timeline. See Basic Settings: Expanding / Collapsing to learn how to expand or collapse them.
Any resource can include a period or periods, which are visualized as timeline elements.
The following data fields are used to set resources:
"name"to set names"id"to set unique identifierschildren/parent(optional) to set the hierarchy
For periods, use:
periodsto add an array of periodsidto set unique identifiersstartto set start datesendto set end dates
To learn how to configure periods, see the Elements: Resource Chart article.
The sample below demonstrates how to set periods and resources and how they look like:
// create data
var data = [
  {
    id: "1",
    name: "Resource",
    periods: [
      {id:"1_1", start: "2018-01-05", end: "2018-01-25"},
      {id:"1_2", start: "2018-01-28", end: "2018-02-22"},
      {id:"1_3", start: "2018-03-03", end: "2018-03-25"}
  ]},
  {
    id: "2",
    name: "Resource",
    periods: [
      {id: "2_1", start: "2018-01-07", end: "2018-02-15"},
      {id: "2_2", start: "2018-02-26", end: "2018-03-20"}
  ]},
  {
    id: "3",
    name: "Resource",
    periods: [
      {id: "3_1", start: "2018-01-04", end: "2018-03-25"}
  ]}
];

// create a data tree
var treeData = anychart.data.tree(data, "as-table");

// create a chart
var chart = anychart.ganttResource();

// set the data
chart.data(treeData);
Connectors
A connector is an element showing the dependencies between periods.
The following data fields are used to set connectors:
connectToto set the target periodconnectorTypeto set the connector typeconnector(optional) to configure individual connectors
To add a connector, you should add these fields to a predecessor period. In the connectTo field, specify the id value of the successor period. In connectorType, specify the type of the connector.
There are four connector types, which are listed in anychart.enums.ConnectorType:
| Type | Description |
|---|---|
"start-start" | The predecessor must start before the successor can start. |
"start-finish" | The predecessor must start before the successor can finish. |
"finish-start" | The predecessor must finish before the successor can start. |
"finish-finish" | The predecessor must finish before the successor can finish. |
To learn how to configure connectors, see the Elements: Resource Chart article.
Please note that a period can have several predecessors, but only one successor. Also, a period can be at the same time a successor to one period or periods and a predecessor to another. All these nuances are illustrated by the sample below, which visualizes the following dependencies between periods:
- Period 01.28 (predecessor) → Period 01.07 (successor) -
"start-finish" - Period 03.01 (predecessor) → Period 03.05 (successor) -
"start-start" - Period 03.05 (predecessor) → Period 03.01 (successor) -
"finish-finish" - Period 01.04 (predecessor) → Period 03.01 (successor) -
"finish-start"
// create data
var data = [
  {
    id: "1",
    name: "Resource",
    periods: [
      {id:"1_1", start: "2018-01-05", end: "2018-01-25"},
      {id:"1_2", start: "2018-01-28", end: "2018-02-22",
       connectTo: "2_1", connectorType: "start-finish"},
      {id:"1_3", start: "2018-03-01", end: "2018-03-25",
       connectTo: "2_2", connectorType: "start-start"}
  ]},
  {
    id: "2",
    name: "Resource",
    periods: [
      {id: "2_1", start: "2018-01-07", end: "2018-02-15"},
      {id: "2_2", start: "2018-03-05", end: "2018-03-18",
       connectTo: "3_2", connectorType: "finish-finish"}
  ]},
  {
    id: "3",
    name: "Resource",
    periods: [
      {id: "3_1", start: "2018-01-04", end: "2018-02-20",
       connectTo: "3_2", connectorType: "finish-start"},
      {id: "3_2", start: "2018-03-01", end: "2018-03-20"}
  ]}
];
Markers
You can add a marker or multiple markers to a resource. A marker can be shown on a period or anywhere on the timeline, depending on the date you specify. For more information, see Elements: Markers.