Overview
Overview
A Gantt chart is a tool used to schedule projects or show resources (e.g., equipment or employees) over periods of time. Project tasks or periods are visualized as horizontal bars, their width representing the duration.
AnyGantt allows creating two types of Gannt charts - Project and Resource. They display different timeline elements, but share most settings.
Both chart types are defined as instances of the anychart.charts.Gantt class. To create them, use the anychart.ganttProject and anychart.ganttResource() constructors.
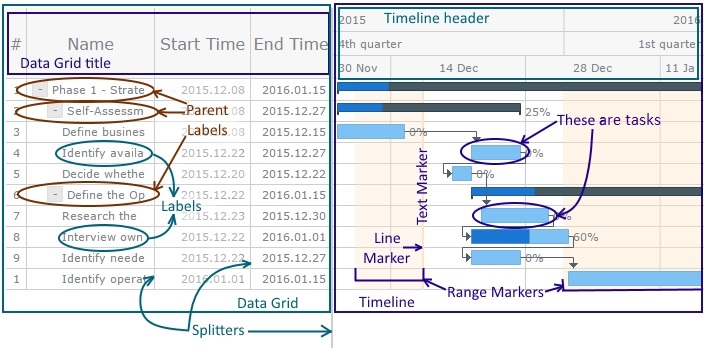
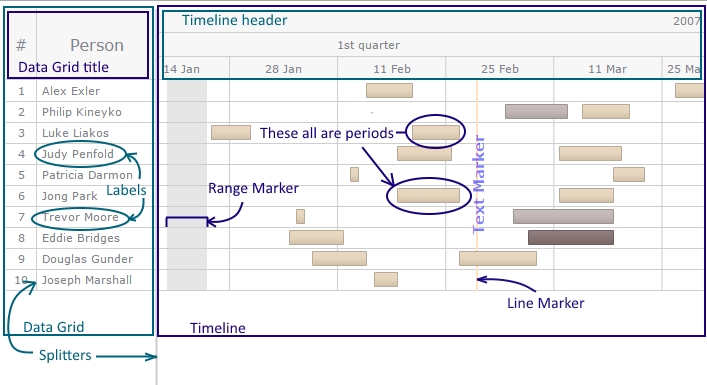
This is how the Project chart and Resource chart are structured:
Project Gantt Chart
Resource Gantt Chart
Articles
The first four articles explain how to create Project and Resource charts:
To learn about data and date & time formats, see these articles:
Here the basic settings are listed - appearance, row height, navigation, etc.:
The following sections explain how to adjust the main parts of the Gantt chart:
There are also advanced settings available:
Modules
AnyGantt requires adding two modules - Core and Gantt:
<script src="https://cdn.anychart.com/releases/8.14.1/js/anychart-core.min.js" type="text/javascript"></script>
<script src="https://cdn.anychart.com/releases/8.14.1/js/anychart-gantt.min.js" type="text/javascript"></script>
Classes
Below you can find the list of classes used to configure the Gantt chart and its parts.
Gantt chart:
- Project and Resource charts - anychart.charts.Gantt
Data grid:
- data grid - anychart.core.ui.DataGrid
- columns - anychart.core.ui.DataGrid.Column
- buttons - anychart.core.gantt.DataGridButton
Timeline:
- timeline - anychart.core.ui.Timeline
- line markers - anychart.core.axisMarkers.GanttLine
- range markers - anychart.core.axisMarkers.GanttRange
- text markers - anychart.core.axisMarkers.GanttText
- header - anychart.core.gantt.TimeLineHeader
Timeline elements:
- regular tasks - anychart.core.gantt.elements.TasksElement
- parent tasks - anychart.core.gantt.elements.GroupingTasksElement
- milestones - anychart.core.gantt.elements.MilestonesElement
- previews of milestones - anychart.core.gantt.elements.MilestonesPreviewElement
- baselines - anychart.core.gantt.elements.BaselinesElement
- progress bars - anychart.core.gantt.elements.ProgressElement
- connectors - anychart.core.gantt.elements.ConnectorElement
- periods - anychart.core.gantt.elements.PeriodsElement
- all elements - anychart.core.gantt.elements.TimelineElement