Project Gantt Chart
Overview
The Project Gantt chart, defined as an instance of anychart.charts.Gantt class, is used to schedule projects.
Project tasks are visualized as horizontal bars, their width representing the duration. It is also possible to show the progress of tasks as well as hierarchical relationships and connections between them.
This is how the Project chart is structured:
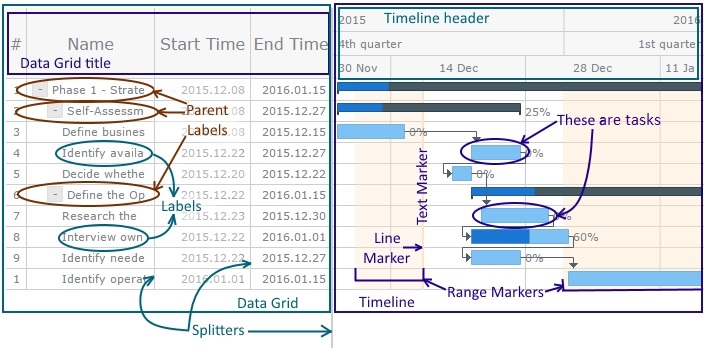
This article explains how to organize data for the Project chart and what timeline elements it displays.
Quick Start
To create a Project Gantt chart, use the anychart.ganttProject chart constructor, like in the sample below. To learn more, see the Quick Start (Project) article.
// create data
var data = [
  {
    id: "1",
    name: "Development",
    actualStart: "2018-01-25",
    actualEnd: "2018-03-10",
    children: [
      {
        id: "1_1",
        name: "Analysis",
        actualStart: "2018-01-25",
        actualEnd: "2018-02-08"
      },
      {
        id: "1_2",
        name: "Design",
        actualStart: "2018-02-04",
        actualEnd: "2018-02-14"
      },
      {
        id: "1_3",
        name: "Meeting",
        actualStart: "2018-02-15",
        actualEnd: "2018-02-15"
      },
      {
        id: "1_4",
        name: "Implementation",
        actualStart: "2018-02-15",
        actualEnd: "2018-02-27"
      },
      {
        id: "1_5",
        name: "Testing",
        actualStart: "2018-02-28",
        actualEnd: "2018-03-10"
      }
  ]}
];

// create a data tree
var treeData = anychart.data.tree(data, "as-tree");

// create a chart
var chart = anychart.ganttProject();

// set the data
chart.data(treeData);

// set the container id
chart.container("container");

// initiate drawing the chart
chart.draw();
Data
Data Fields
The Project chart requires setting tasks by using the following data fields:
idto set unique identifiersnameto set namesactualStartto set start datesactualEndto set end dates
In addition, you can use optional fields:
children/parentto set the hierarchybaselineStartandbaselineEndto add baselinesprogressValueto add progress barsconnectToandconnectorTypeto add connectorsactual,baseline,progress, andconnectorto configure individual elementsmarkersto add markersrowHeightto set the row heightcollapsedto expand or collapse a parent task
Note 1: To learn how to rename the default data fields, see Data: Mapping.
Note 2: You can also add custom fields to your data and use them to configure text - like, for example, in all the samples from Timeline: Tooltips.
Setting Data
To create a Project chart, you should use the tree data model and organize your data either as a tree or as a table.
1. Creating Data Tree. The first step is creating a data tree by passing your data to the anychart.data.tree() method with "as-tree" or "as-table" as the second parameter:
var treeData = anychart.data.tree(data, "as-tree");
var treeData = anychart.data.tree(data, "as-table");
If the hierarchy between data items is not specified, there is no difference between the tree and table structures, and both parameters can be used.
2. Creating Chart. Then create a Project chart by using the anychart.ganttProject() chart constructor:
var chart = anychart.ganttProject();
3. Setting Data. Finally, pass the data tree to the data() method of the chart:
chart.data(treeData);
You can as well skip the first step and pass your data directly to the data() method, also with the "as-tree" or "as-table" parameter. In this case the data tree is created implicitly.
Hierarchy
Usually, there are hierarchical relationships between data items of Project Gantt charts. There are two ways to specify these relationships, depending on how you organize the data: as a tree or as a table.
Please note that Project charts can have multiple roots. Also, you can create data without specifying the hierarchy - in this case, technically, all items are roots.
As Tree
If you organize data as a tree, each parent item should have a children data field where an array of child items is specified.
The following sample shows how to set data with two roots as a tree:
// create data
var data = [
  {
    id: "1",
    name: "Development",
    actualStart: "2018-01-25",
    actualEnd: "2018-03-10",
    children: [
      {
        id: "1_2",
        name: "Analysis",
        actualStart: "2018-01-25",
        actualEnd: "2018-02-08"
      },
      {
        id: "1_3",
        name: "Design",
        actualStart: "2018-02-04",
        actualEnd: "2018-02-14"
      },
      {
        id: "1_4",
        name: "Meeting",
        actualStart: "2018-02-15",
        actualEnd: "2018-02-15"
      },
      {
        id: "1_5",
        name: "Implementation",
        actualStart: "2018-02-15",
        actualEnd: "2018-02-27"
      },
      {
        id: "1_6",
        name: "Testing",
        actualStart: "2018-02-28",
        actualEnd: "2018-03-10"
      }
  ]},
  {
    id: "2",
    name: "PR Campaign",
    actualStart: "2018-02-15",
    actualEnd: "2018-03-22",
    children: [
      {
        id: "2_1",
        name: "Planning",
        actualStart: "2018-02-15",
        actualEnd: "2018-03-10"
      },
      {
        id: "2_2",
        name: "Promoting",
        actualStart: "2018-03-11",
        actualEnd: "2018-03-22"
      }
  ]}
];

// create a data tree
var treeData = anychart.data.tree(data, "as-tree");

// create a chart
var chart = anychart.ganttProject();

// set the data
chart.data(treeData);
As Table
If you organize data as a table, in the parent field of each item, you should specify the id value of its parent. The parent of a root item should be set to null or just not specified.
This sample shows how to set data with two roots as a table:
// create data
var data = [
  {
    id: "1",
    name: "Development",
    actualStart: "2018-01-25",
    actualEnd: "2018-03-10"
  },
  {
    id: "1_2",
    parent: "1",
    name: "Analysis",
    actualStart: "2018-01-25",
    actualEnd: "2018-02-08"
  },
  {
    id: "1_3",
    parent: "1",
    name: "Design",
    actualStart: "2018-02-04",
    actualEnd: "2018-02-14"
  },
  {
    id: "1_4",
    parent: "1",
    name: "Meeting",
    actualStart: "2018-02-15",
    actualEnd: "2018-02-15"
  },
  {
    id: "1_5",
    parent: "1",
    name: "Implementation",
    actualStart: "2018-02-15",
    actualEnd: "2018-02-27"
  },
  {
    id: "1_6",
    parent: "1",
    name: "Testing",
    actualStart: "2018-02-28",
    actualEnd: "2018-03-10"
  },
  {
    id: "2",
    name: "PR Campaign",
    actualStart: "2018-02-28",
    actualEnd: "2018-03-22"
  },
  {
    id: "2_1",
    parent: "2",
    name: "Planning",
    actualStart: "2018-02-15",
    actualEnd: "2018-03-10"
  },
  {
    id: "2_2",
    parent: "2",
    name: "Promoting",
    actualStart: "2018-03-11",
    actualEnd: "2018-03-22"
  }
];

// create a data tree
var treeData = anychart.data.tree(data, "as-table");

// create a chart
var chart = anychart.ganttProject();

// set the data
chart.data(treeData);
Elements
This section lists the available types of elements that are shown on the timeline of the Project chart and explains how to use data fields to set them. To learn how to configure elements, see the Elements section.
The main element of the Project chart is the task. Other elements, such as baselines, progress bars, connectors, and markers, are set by adding special data fields to tasks.
Tasks (Actual)
A task is an element showing the actual duration of a task, while the planned duration is represented by the baseline.
The following data fields are used to set tasks:
nameto set namesidto set unique identifiersactualStartto set start datesactualEndto set end dateschildren/parent(optional) to set the hierarchyactual(optional) to configure individual tasks
There are three task types, each of them visualized in a different way:
- regular tasks
- parent tasks
- milestones
The difference between regular tasks and parent tasks lies in their relationships with other tasks: parent tasks have children, and regular ones do not. To set these relationships, use the children or parent data field - read the Hierarchy section to learn more.
Note that if you do not specify the actualStart and actualEnd dates of a parent task, they are calculated automatically from the dates of its children.
Also, see Basic Settings: Expanding / Collapsing to learn how to expand or collapse parent tasks.
Milestones are elements representing events. To add a milestone, you should create a task with zero duration: specify the same date in the actualStart and actualEnd fields.
If you need to create multiple milestones in one row, use an alternative way to visualize events - add markers. Multiple markers can be shown in one row - on a task or anywhere on the timeline depending on the dates you specify. For more information, see Elements: Markers.
To learn how to configure tasks, see the Elements: Project Chart article.
The sample below demonstrates task types. Also, it shows that regular and parent tasks can occupy different places in the hierarchy: a parent task can be a child itself, and a regular task can be a root.
// create data
var data = [
  {
    id: "1",
    name: "Parent Task",
    actualStart: "2018-01-25",
    actualEnd: "2018-03-10",
    children: [
      {
        id: "1_1",
        name: "Task",
        actualStart: "2018-01-15",
        actualEnd: "2018-01-25"
      },
      {
        id: "1_2",
        name: "Task",
        actualStart: "2018-01-20",
        actualEnd: "2018-02-04"
      },
      {
        id: "1_3",
        name: "Milestone",
        actualStart: "2018-02-05",
        actualEnd: "2018-02-05"
      },
      {
        id: "1_4",
        name: "Parent Task",
        actualStart: "2018-02-05",
        actualEnd: "2018-02-24",
        children: [
          {
            id: "1_4_1",
            name: "Task",
            actualStart: "2018-02-05",
            actualEnd: "2018-02-10"
          },
          {
            id: "1_4_2",
            name: "Task",
            actualStart: "2018-02-11",
            actualEnd: "2018-02-24"
          }
      ]},
      {
        id: "2",
        name: "Task",
        actualStart: "2018-02-05",
        actualEnd: "2018-03-10",
      }
  ]}
];

// create a data tree
var treeData = anychart.data.tree(data, "as-tree");

// create a chart
var chart = anychart.ganttProject();

// set the data
chart.data(treeData);
Baselines (Planned)
A baseline is an element showing the planned duration of a regular or parent task.
The following data fields are used to set baselines:
baselineStartto set start datesbaselineEndto set end datesbaseline(optional) to configure individual baselines
By default, baselines are shown under tasks, but can be placed above them - see the Elements: Project Chart article.
In this sample, baselines are added to all regular tasks and the parent one:
// create data
var data = [
  {
    id: "1",
    name: "Development",
    baselineStart: "2018-01-12",
    baselineEnd: "2018-03-04",
    actualStart: "2018-01-15",
    actualEnd: "2018-03-10",
    children: [
      {
        id: "1_1",
        name: "Analysis",
        baselineStart: "2018-01-12",
        baselineEnd: "2018-01-25",
        actualStart: "2018-01-15",
        actualEnd: "2018-01-25"
      },
      {
        id: "1_2",
        name: "Design",
        baselineStart: "2018-01-20",
        baselineEnd: "2018-01-31",
        actualStart: "2018-01-20",
        actualEnd: "2018-02-04"
      },
      {
        id: "1_3",
        name: "Meeting",
        actualStart: "2018-02-05",
        actualEnd: "2018-02-05"
      },
      {
        id: "1_4",
        name: "Implementation",
        baselineStart: "2018-02-01",
        baselineEnd: "2018-02-19",
        actualStart: "2018-02-05",
        actualEnd: "2018-02-24"
      },
      {
        id: "1_5",
        name: "Testing",
        baselineStart: "2018-02-20",
        baselineEnd: "2018-03-05",
        actualStart: "2018-02-25",
        actualEnd: "2018-03-10"
      }
  ]}
];

// create a data tree
var treeData = anychart.data.tree(data, "as-tree");

// create a chart
var chart = anychart.ganttProject();

// set the data
chart.data(treeData);
Progress Bars
A progress bar is an element showing the progress of a regular or parent task. Also, the progress is shown in labels of tasks.
The following data fields are used to set progress bars:
progressValueto set the progress value as a percentageprogress(optional) to configure individual progress bars
By default, the progress value of all tasks is 0%, so progress bars are not shown. If you do not set the progress value of a parent task, it is calculated automatically from the progress values of its children.
To learn how to configure progress bars, see the Elements: Project Chart article.
In the following sample, progress values are added to all regular tasks except for the last one. The progress value of the parent task is calculated automatically.
// create data
var data = [
  {
    id: "1",
    name: "Development",
    actualStart: "2018-01-15",
    actualEnd: "2018-03-10",
    children: [
      {
        id: "1_1",
        name: "Analysis",
        actualStart: "2018-01-15",
        actualEnd: "2018-01-25",
        progressValue: "75%"
      },
      {
        id: "1_2",
        name: "Design",
        actualStart: "2018-01-20",
        actualEnd: "2018-02-04",
        progressValue: "100%"
      },
      {
        id: "1_3",
        name: "Meeting",
        actualStart: "2018-02-05",
        actualEnd: "2018-02-05"
      },
      {
        id: "1_4",
        name: "Implementation",
        actualStart: "2018-02-05",
        actualEnd: "2018-02-24",
        progressValue: "60%"
      },
      {
        id: "1_5",
        name: "Testing",
        actualStart: "2018-02-25",
        actualEnd: "2018-03-10"
      }
  ]}
];

// create a data tree
var treeData = anychart.data.tree(data, "as-tree");

// create a chart
var chart = anychart.ganttProject();

// set the data
chart.data(treeData);
Connectors
A connector is an element showing the dependencies between all task types.
The following data fields are used to set connectors:
connectToto set the target taskconnectorTypeto set the connector typeconnector(optional) to configure individual connectors
To add a connector, you should add these fields to a predecessor task. In the connectTo field, specify the id value of the successor task. In connectorType, specify the type of the connector.
There are four connector types, which are listed in anychart.enums.ConnectorType:
| Type | Description |
|---|---|
"start-start" | The predecessor must start before the successor can start. |
"start-finish" | The predecessor must start before the successor can finish. |
"finish-start" | The predecessor must finish before the successor can start. |
"finish-finish" | The predecessor must finish before the successor can finish. |
To learn how to configure connectors, see the Elements: Project Chart article.
Please note that a task can have several predecessors, but only one successor. Also, a task can be at the same time a successor to one task or tasks and a predecessor to another. All these nuances are illustrated by the sample below, which visualizes the following dependencies between tasks:
- Task 1 (predecessor) → Task 2 (successor) -
"finish-start" - Task 2 (predecessor) → Task 5 (successor) -
"start-start" - Task 3 (predecessor) → Task 4 (successor) -
"finish-finish" - Task 4 (predecessor) → Task 5 (successor) -
"start-finish"
// create data
var data = [
  {
    id: "1",
    name: "Tasks",
    actualStart: "2018-02-02",
    actualEnd: "2018-02-25",
    children: [
      {
        id: "1_1",
        name: "Task 1",
        actualStart: "2018-02-02",
        actualEnd: "2018-02-07",
        connectTo: "1_2",
        connectorType: "finish-start"
      },
      {
        id: "1_2",
        name: "Task 2",
        actualStart: "2018-02-09",
        actualEnd: "2018-02-09",
        connectTo: "1_5",
        connectorType: "start-start"
      },
      {
        id: "1_3",
        name: "Task 3",
        actualStart: "2018-02-11",
        actualEnd: "2018-02-23",
        connectTo: "1_4",
        connectorType: "finish-finish"
      },
      {
        id: "1_4",
        name: "Task 4",
        actualStart: "2018-02-18",
        actualEnd: "2018-02-25",
        connectTo: "1_5",
        connectorType: "start-finish"
      },
      {
        id: "1_5",
        name: "Task 5",
        actualStart: "2018-02-15",
        actualEnd: "2018-02-21"
      }
  ]}
];
Milestones and Markers
To visualize an event, add a task with zero duration, or milestone. See the Tasks (Actual) section and Elements: Project Chart article to learn more.
If you need to create multiple milestones in one row, use an alternative way to visualize events - add markers. Multiple markers can be shown in one row - on a task or anywhere on the timeline depending on the dates you specify. For more information, see Elements: Markers.